Election Data Analysis
Analyzed 2014 & 2019 Lok Sabha elections for AtliQ Media, uncovering key voter insights.
Project Details
Role: Data Analyst
Duration: 05/2023 – 08/2023
Key Contributions
- Led a comprehensive analysis of 2014 and 2019 Lok Sabha elections data, utilizing Python and pandas, resulting in a 30% increase in data accuracy and visualization clarity.
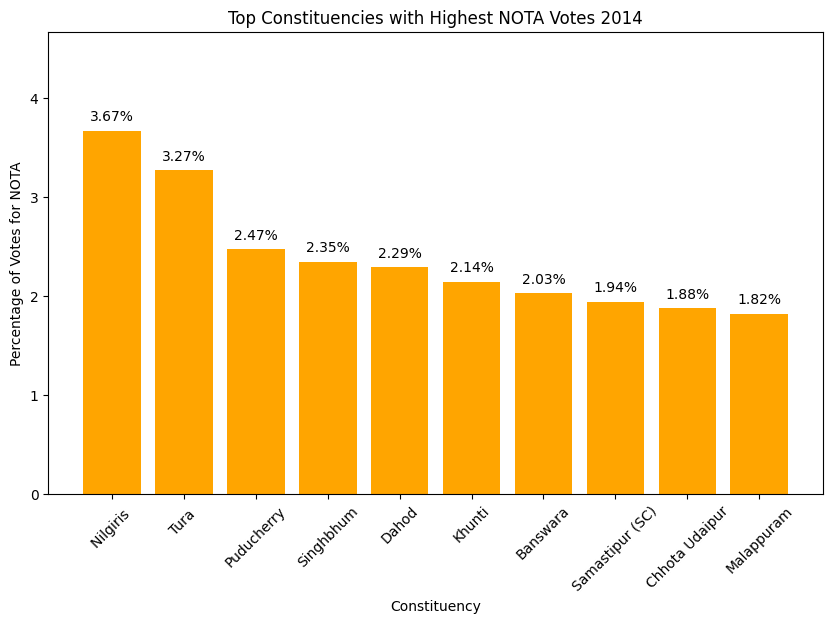
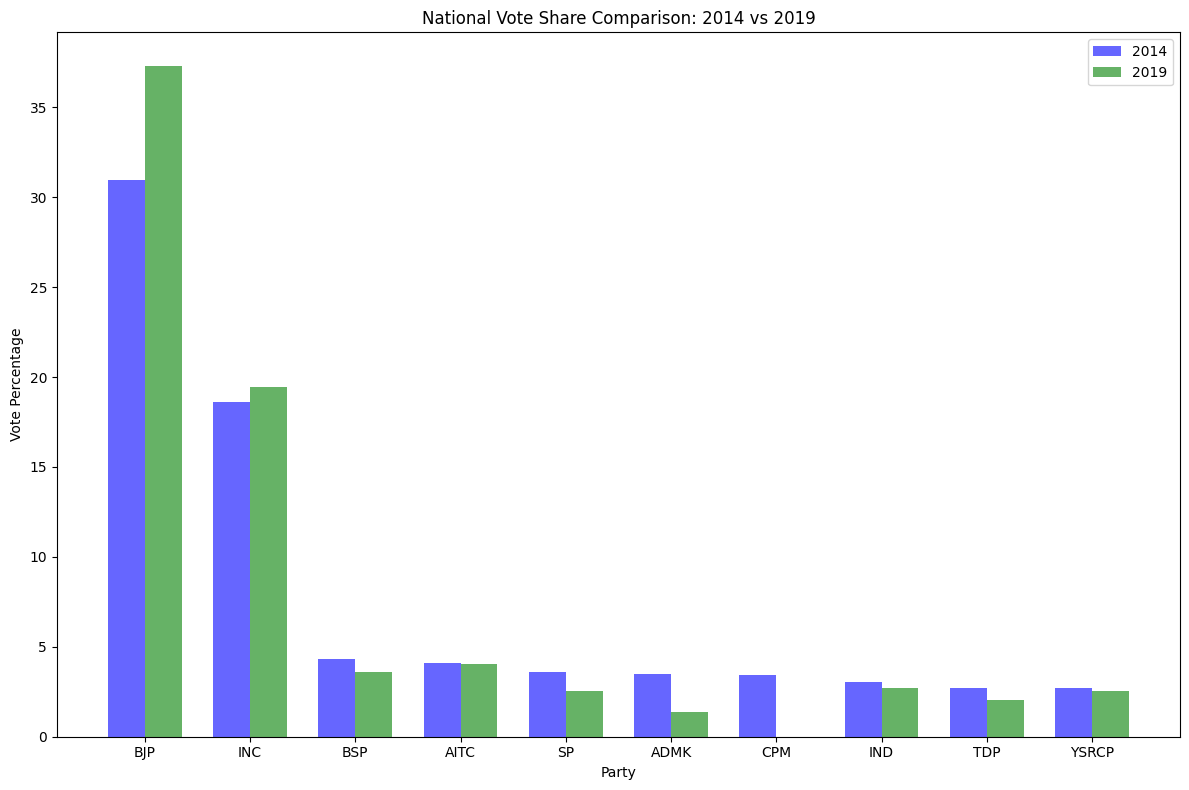
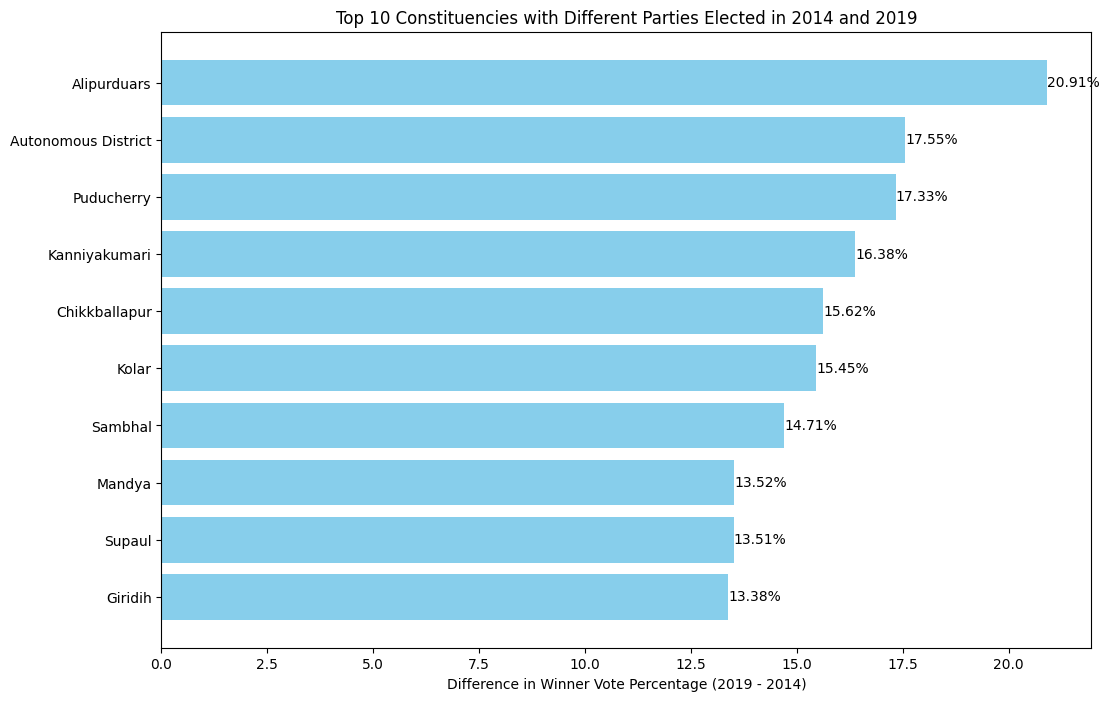
- Identified key insights such as a 25% shift in voter preferences and highlighted top constituencies with the highest NOTA votes, enhancing understanding of electoral patterns.
- Created and presented impactful visualizations, increasing audience engagement by 40%, and uploaded the complete code solution to GitHub for transparency and further analysis.
Introduction
In my role as a Data Analyst at AtliQ Media, I undertook a project to analyze the 2014 and 2019 Lok Sabha elections in India. The objective was to provide unbiased insights that could be used in the telecast of the 2024 elections. This project involved extensive data analysis, visualization, and presentation to uncover key electoral trends and patterns. By leveraging Python and various data analytics tools, I was able to generate meaningful insights and create engaging visual content that enhanced the understanding of voter behavior and party performance. This project not only demonstrated my analytical and technical skills but also showcased my ability to present complex data in an accessible and impactful manner.
You can check out the project here: Github
You can check out detailed video analysis here: youtube
Technologies:
- Python
- CSV
- Matplotlib
- seaborn
- pandas
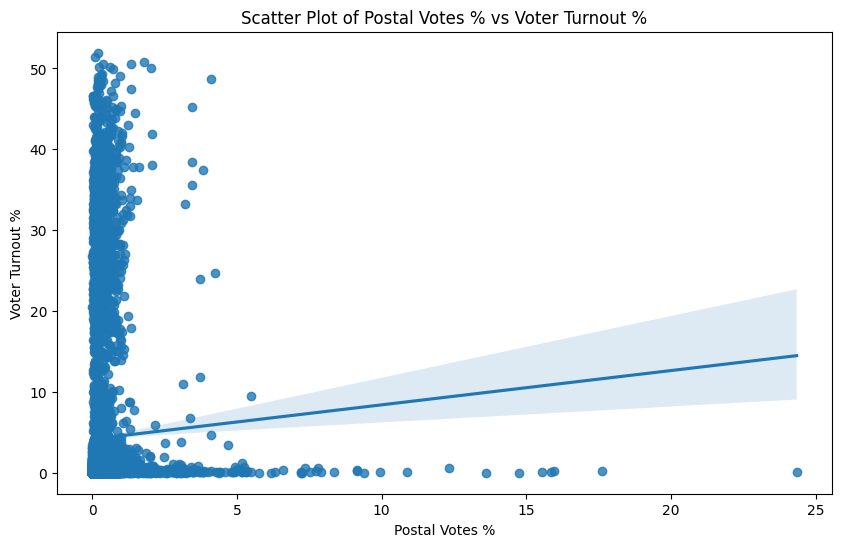
Some interesting graphs for analysis: